
01
Hierarchy before density
The information that matters now draws your eye first. Supporting context stays available without competing for attention.
BASALT Charts brings futures and crypto order flow into your browser. See volume, absorption, and shifting pressure alongside your execution platform.
BASALT does not remove sophisticated information. It is opinionated about how that information earns your attention.
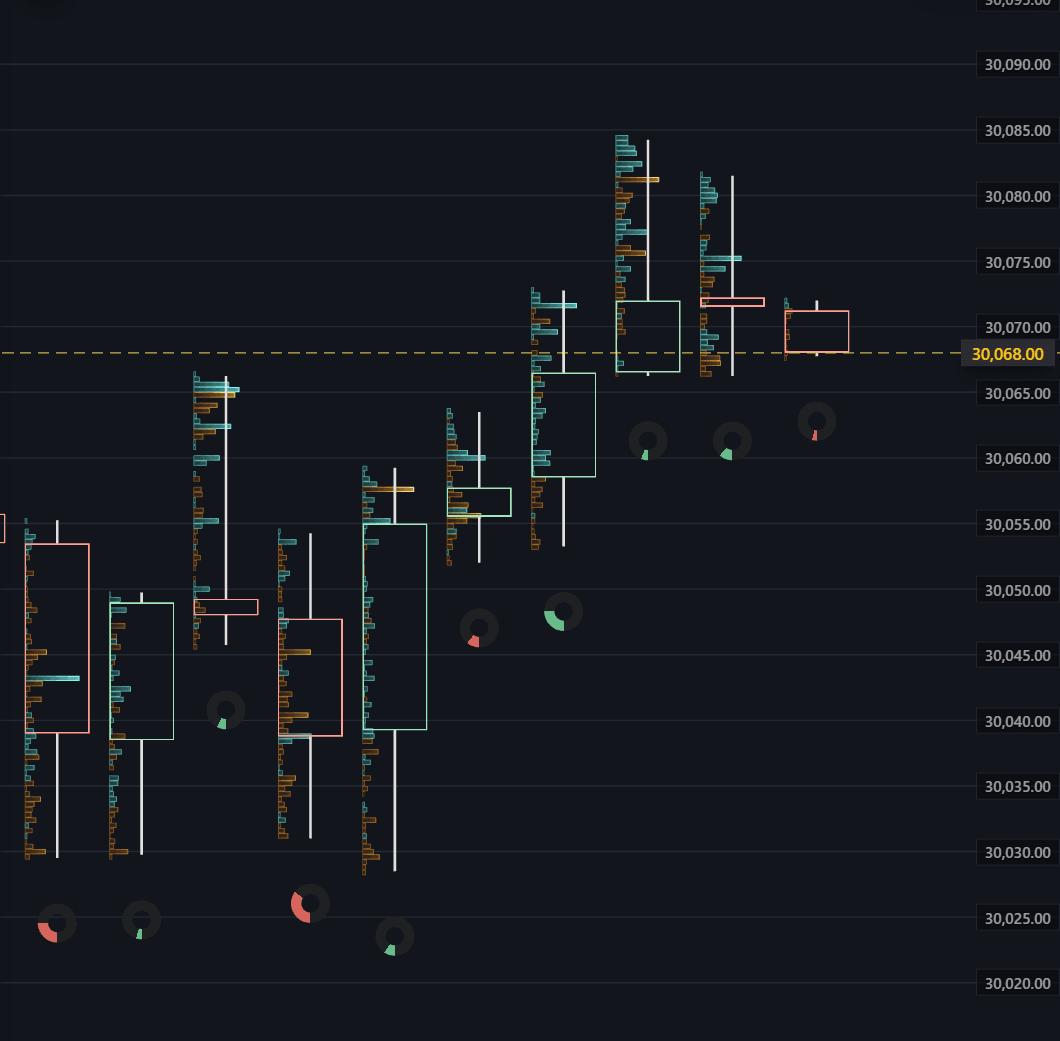
BASALT turns live market activity into visual shape and responsive feedback, helping you read changing conditions without scanning a wall of tiny numbers.
The information that matters now draws your eye first. Supporting context stays available without competing for attention.
Changes in pressure, pace, and participation are reinforced through responsive movement—not decorative animation.
Advanced context remains close at hand, organized in layers you can scan instead of panels you have to decode.
Layer regime, volume, sentiment, and absorption around the chart so each view adds context without fighting for attention.
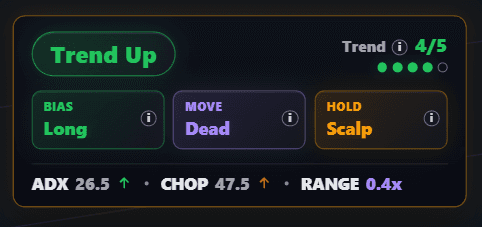
See trend, chop, bias, and movement state before you give a setup your attention.
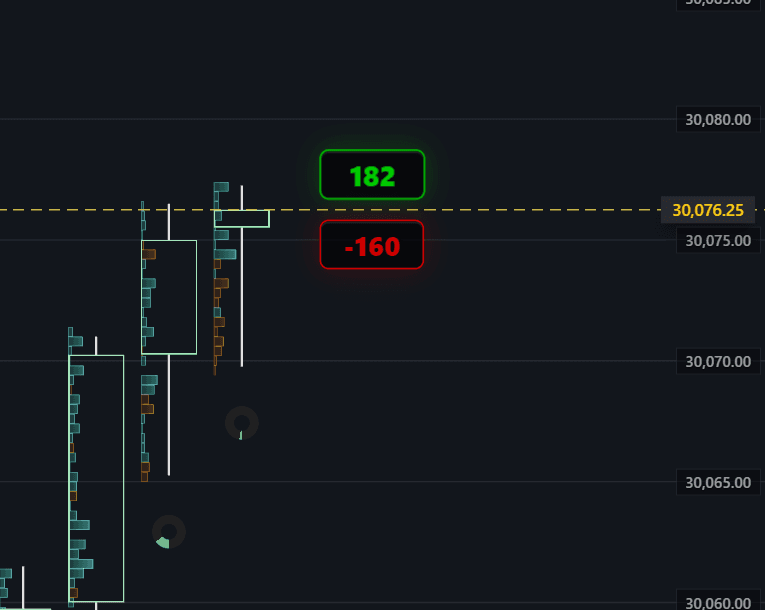
Keep buy and sell volume close to current price action as market pressure changes.
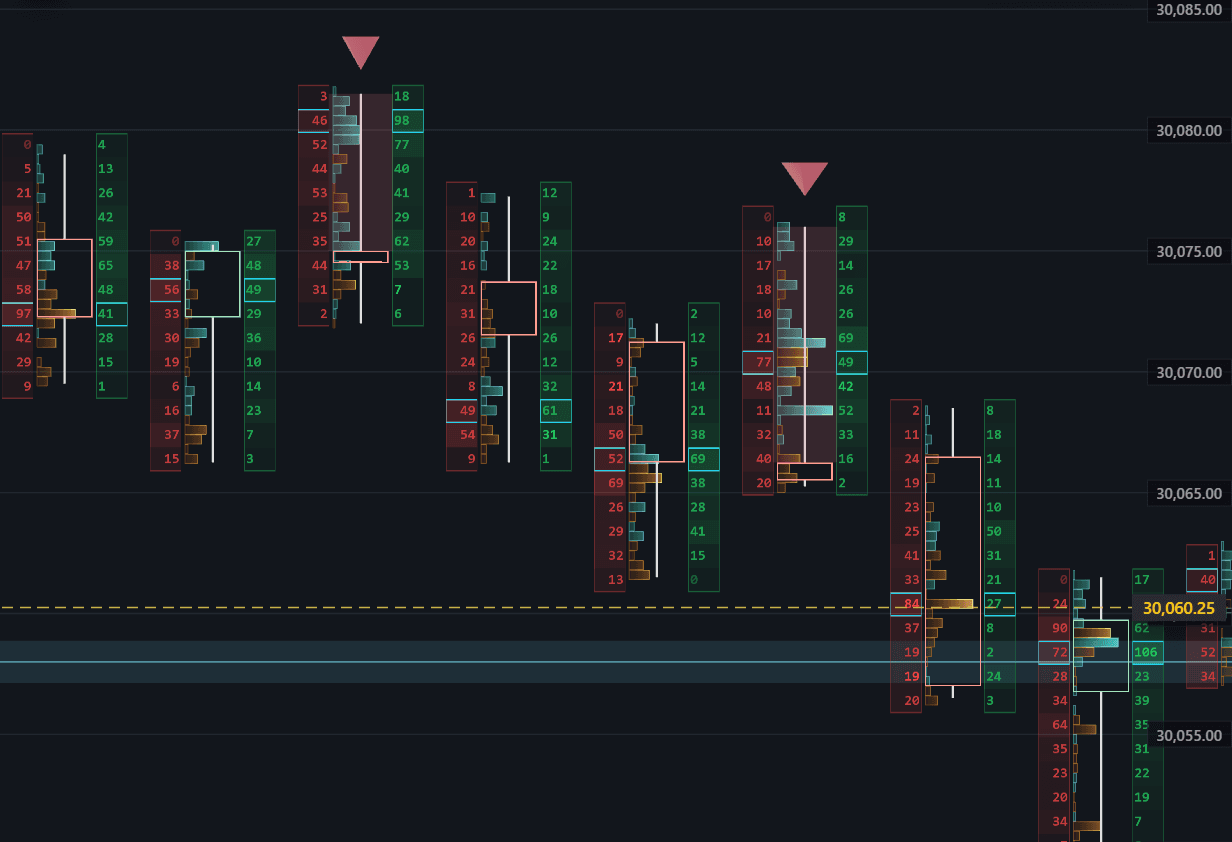
Surface rejected activity and wick absorption as visual context instead of another numeric grid.
Paid plans include real-time exchange market data with rapid tick-based updates. No separate feed account, API keys, or vendor setup required.
Coverage and availability may vary by market and instrument.
Marc
Founder, BASALT Charts
I love trading with order flow. Watching buyers and sellers interact helps me understand what's happening as a setup unfolds. But every solution I tried felt outdated, hard to read, and convoluted. I wanted to build a modern platform that made that activity easier to see and understand, with new features I hadn't found in any other charting platform.
After five years trading futures in funded prop firm accounts and twelve years developing software, I built BASALT Charts to bring that experience to life. I use it in my own trading every session, and the questions I ask at the chart keep shaping what I build next. You can follow along in our Discord community.
Open the live NQ or SOLUSDT demo in your browser. No account, credit card, or download required.